Comparing Recommendation Lists
In my research, I am trying to understand how different recommender algorithms behave in different situations. We’ve known for a while that ‘different recommenders are different’1, to paraphrase Sean McNee. However, we lack thorough data on how they are different in a variety of contexts. Our RecSys 2014 paper, User Perception of Differences in Recommender Algorithms (by myself, Max Harper, Martijn Willemsen, and Joseph Konstan), reports on an experiment that we ran to collect some of this data.
I have done some work on this subject in offline contexts already; my When Recommenders Fail paper looked at contexts in which different algorithms make different mistakes. LensKit makes it easy to test many different algorithms in the same experimental setup and context. This experiment brings my research goals back into the user experiment realm: directly measuring the ways in which users experience the output of different algorithms as being different.
The Tools
To run this experiment, we took advantage of a number of resources that, together, enable some really fun experimental capabilities:
- MovieLens, our movie recommendation service, and the fact that Max Harper and a team of students are working on building a brand-new version of it.
- LensKit, allowing us to drop multiple algorithms into the same context (in this case, MovieLens).
- Structural equation modeling and the user-centric evaluation framework developed by Knijnenburg et al.
In addition to colleagues at Minnesota, we were privileged to collaborate with Martijn Willemsen at the Eindhoven University of Technology on this project. Protip: if you want to measure what people think, collaborate with a psychologist. It will work out much better than just trying to do it yourself. The quality of our user experiments and survey instruments has increased substantially since beginning to work with Martijn.
The Questions
The high-level goal of this experiment was to see how users perceive different recommender algorithms to produce different recommendations. To make this goal actionable, we developed the following research questions:
- What subjective properties of a recommendation list affect a user’s preference between different recommendation lists?
- What different subjective properties to the lists produced by different algorithms have?
- How can these subjective properties be estimated with objectively-measurable properties of the lists?
We studied these in the context of selecting a recommender for movies.
The Setup
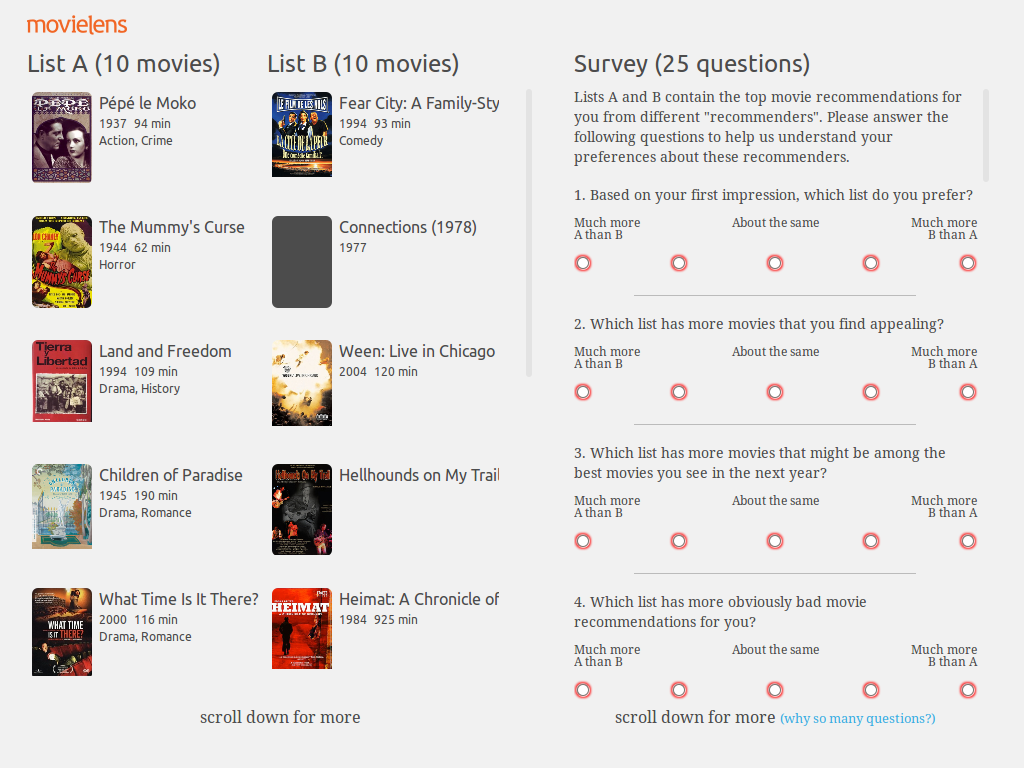
For a few months, users were invited to try out a beta of the new MovieLens. After they logged in, they got this screen:

Each user received recommendation lists from 2 different algorithms, along with a survey with 25 questions asking for the following:
- Their first-impression preference between the two lists. This question had a 5-point response, ‘A much more than B’ to ‘B much more than A’.
- 22 questions targeting 5 factors of subjective user preference, including diversity, novelty, and satisfaction. Each of these was also relative, collecting data such as ‘List A has a much more diverse collection of movies than list B’.
- A forced-choice question to select a list to be the default recommender in the new MovieLens.
- An open-ended question for other differences and feedback.
The Results
The paper contains all the gory details, including some novel analysis techniques that want to write more about later, but here are the highlights:
- User choice of recommendation list depended on their satisfaction. The effect of other properties is mostly mediated through satisfaction.
- Users were more satisfied with more diverse recommendation lists.
- users were less satisfied with lists with more novel items.
- User-user did poorly, and had very high novelty.
- Item-item and SVD performed similarly; item-item’s recommendations were more diverse.
- Certain objective metrics — RMSE, intra-list similarity, and item obscurity — correlated with perceived satisfaction, diversity, and novelty, respectively. The effects of these metrics was entirely mediated through the corresponding subjective prperties, meaning that they do not have additional predctive power for the user’s final choice. However, they did not capture all of the signal: there are additional aspects of diversity, for example, that are not captured by the intra-list similarity metric.
Come to my talk Wednesday at RecSys 2014 or read the paper to learn more!
I believe I owe this phrasing to my colleague Morten Warncke-Wang.↩︎